A report answers one question about your store, such as what sold best, where sales came from or how many visitors reached the checkout. Poltura comes with ready reports. Every query you save in Explore is added to them.
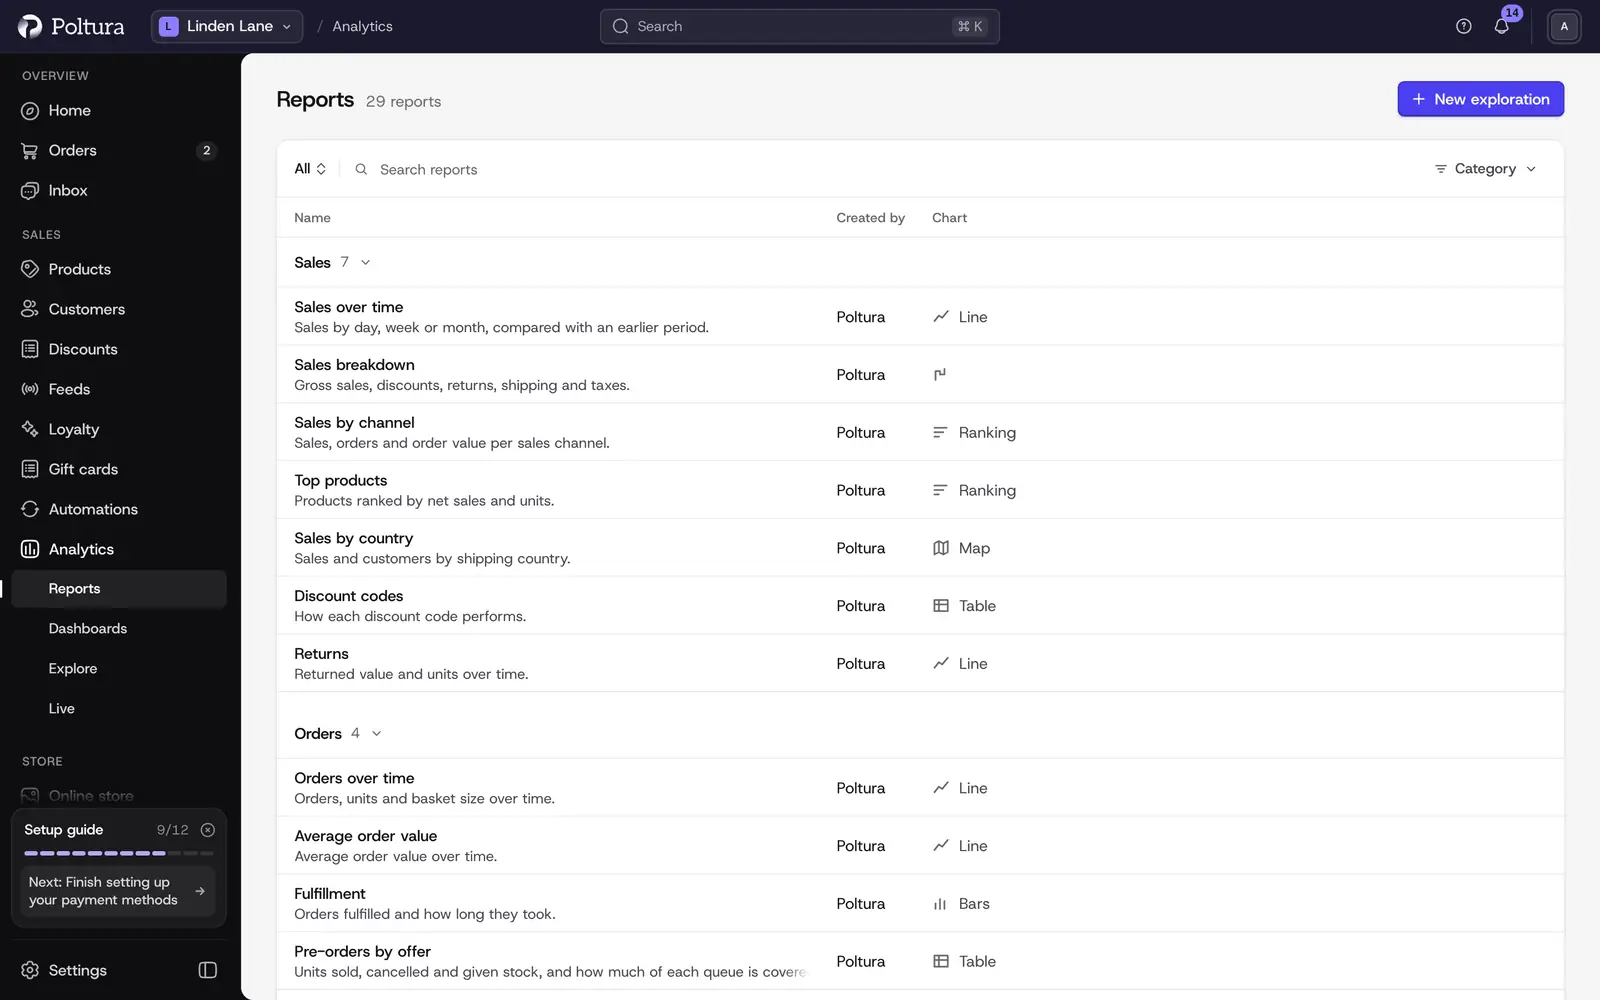
What the report library holds
The built-in reports come in seven categories:
- Sales: for example Sales breakdown, Sales by channel, Top products, Sales by country, Discount codes and Returns.
- Orders: Orders over time, Average order value and Fulfillment.
- Customers: Customers, New vs returning and Cohort retention.
- Acquisition: sessions over time and by referrer and location, Sales by referrer and Campaigns.
- Behaviour: Checkout funnel, Sessions by device, Landing pages, Engagement and Traffic by day and hour.
- Inventory: Sell-through, Inventory remaining and Stock-outs.
- Retail: point-of-sale sales by location and over time, for stores with a point-of-sale channel.
Reports you saved yourself show the category you gave them, or Custom.
Find a report
Under Analytics in the sidebar, choose Reports.
Type in Search reports, or narrow the list with Category.
Use Created by to see only reports from Poltura, from Your team or your own (Me).
Click a report's name to open it.
The list shows each report's name, its chart type (line, bars, ranking, funnel, heatmap, map, table and others) and who made it. Clear filters brings the full list back.
Read a report
A report page has its key figures on top, then a chart, then the Data table with the same numbers.
Open the report.
Choose the date range and, if you want one, a comparison: Previous period or Previous year.
Where the report offers it, pick another Metric and change the Granularity to Daily, Weekly or Monthly.
Read the chart and scroll to Data for the exact numbers.
Under Query you see the query behind the report. You do not need to read it to use the report, but it is the starting point when you want to change something.
Add a report to a dashboard
Open the report and click Add to dashboard.
Choose the Dashboard, or New dashboard to start one.
Choose the Size of the tile.
Click Add. The message "Added to" with the dashboard's name appears, and View opens the dashboard.
Only dashboards you can edit are offered. The built-in dashboards cannot be changed, so duplicate one first, see Dashboards. Adding a report to a dashboard is part of the Pro plan, see Plans.
Change a report
The built-in reports cannot be edited, but on the Pro plan you can make your own version.
Open the report and click Open in Explore, or Edit in Explore next to the query.
Change the query or use the controls, see Explore.
Click Save as report and give it a name. Your report now appears in the library with the Saved report badge.
New exploration on the Reports page starts from an empty query instead.
Good to know
- Reports on sessions, visitors, devices, landing pages and the checkout funnel need the store's visitor tracking. Reports on sales by referrer and by campaign work without it.
- Visits are grouped into channels such as direct, organic and paid search, organic and paid social, email and referral, and an order is credited to the channel of the last click before it.
- Days follow your store's time zone, see Store details.
- Downloading the numbers as a CSV file is possible in Explore, on the Pro plan, not on a report page.
Plans
The built-in reports are on every plan, with their date range, comparison, metric and granularity controls. Saving your own reports, changing a report in Explore and adding a report to a dashboard are part of the Pro plan, see Explore. On other plans these buttons show which plan unlocks them.
If you move from Pro to another plan, the reports you saved stay in the library and keep showing your numbers. You can open and delete them, but you cannot change them or open them in Explore until you are on Pro again.
If something goes wrong
- "No reports match these filters." Click Clear filters.
- "Saved reports could not be loaded. The built-in reports still work." Your own reports are missing for the moment. Try again in a minute.
- "Report not found". It may have been deleted, or it belongs to someone else.
- "That dashboard already has this report." Pick another dashboard, or open the dashboard to see the tile.
- "You have no dashboards you can edit yet." Choose New dashboard in the same dialog.