Analytics shows your store's sales, orders, customers, traffic and stock without any setup. It comes with the store. The figures are counted from your own orders and visits.
What you see on the Overview
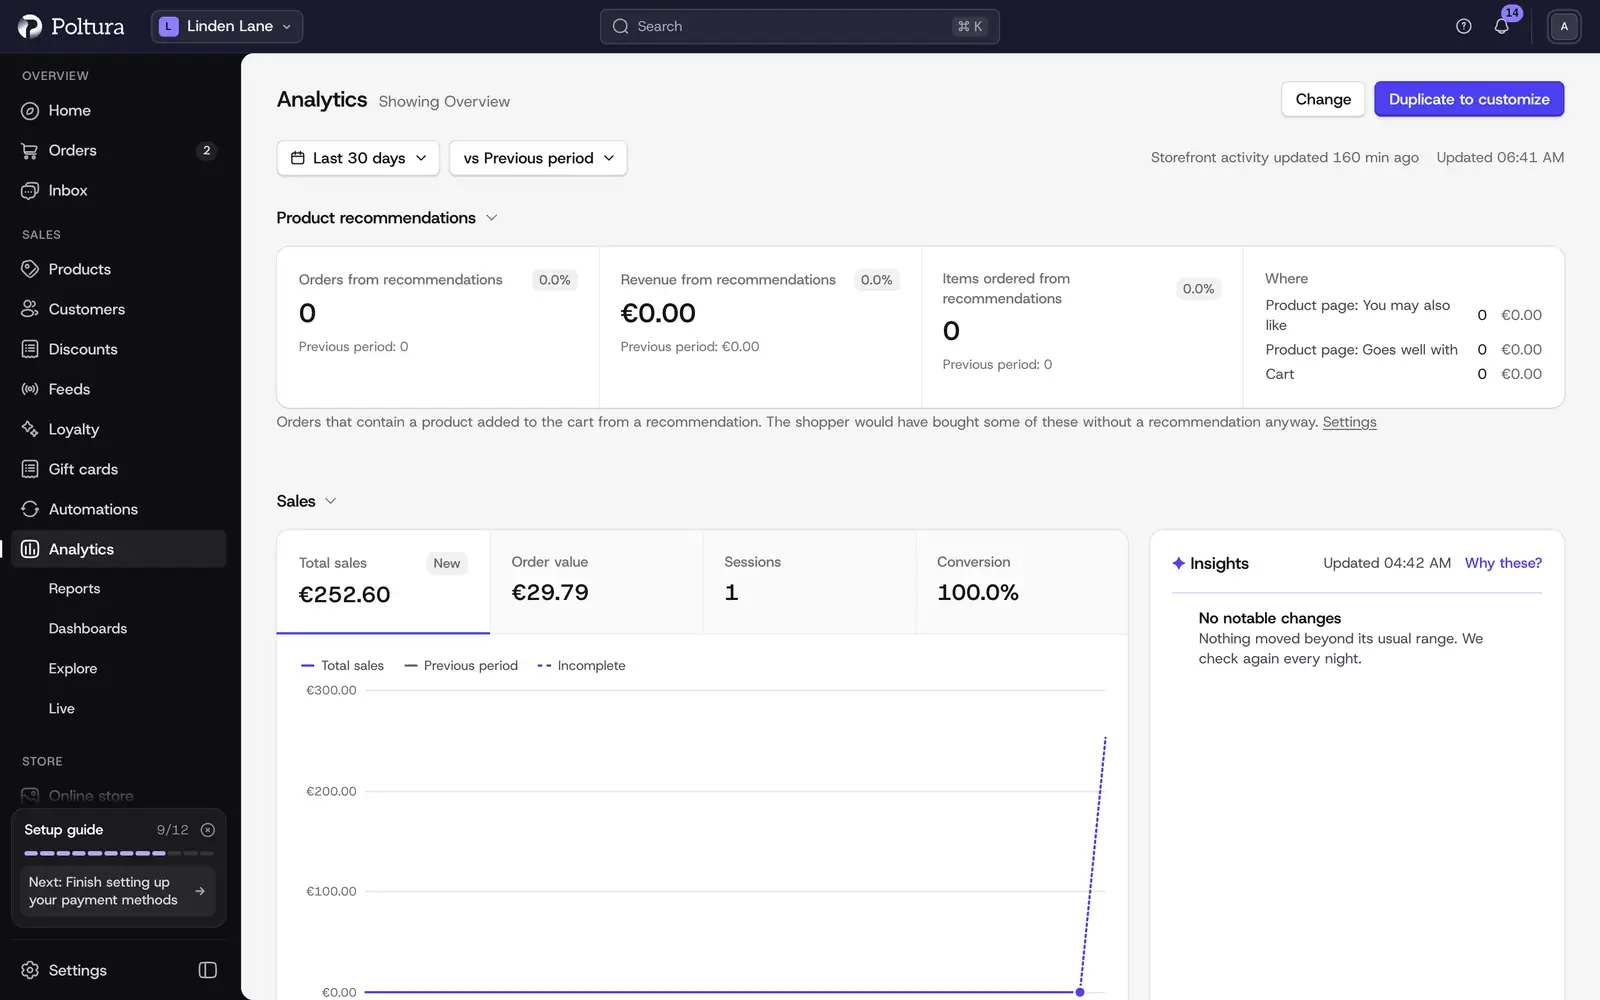
Analytics opens on Overview, a dashboard of your key numbers. The built-in one shows sales and orders, how sales split by channel and product, sessions and conversion, where visitors come from, returning customers and how fast your stock sells.
In the sidebar, Analytics opens the Overview and the entries under it lead to the other parts:
- Overview (Analytics itself): the dashboard you chose to see first.
- Reports: ready reports on one question each. See Reports.
- Dashboards: the built-in dashboards and, on the Pro plan, the ones you build. See Dashboards.
- Explore: a query editor for questions the ready reports do not answer, on the Pro plan. See Explore.
- Live: visitors, carts and orders as they happen. See Live view.
Choose the date range and a comparison
Open Analytics.
Open the date range picker and choose a range, for example Last 30 days, Month to date or Last 12 months.
Open the comparison picker and choose Previous period, Previous year or No comparison.
Every tile now shows the chosen range, and the key figures show the change against the comparison.
The range is part of the page's link. Copy the link from your browser to show a colleague the same view. A view opened from such a link says Range from the link, and Use dashboard default goes back to the dashboard's own range.
Read the insights
Insights point out what changed. Every night your finished days are compared with the period before. Changes beyond their usual range are flagged: a trend, an unusual day, a streak, what drove a change, a new top performer, or stock that may run out. The biggest money impact comes first. Why these? explains the selection, and Explore on an insight opens its figures in Explore, on the Pro plan.
Insights appear after two weeks of sales data.
Change which dashboard opens first
Each team member can choose their own Overview.
On Overview, click Change next to Showing and the dashboard's name. The Dashboards list opens.
Open the menu of the dashboard you want and choose Set as Overview.
The message "Overview now shows this dashboard" confirms it.
Good to know
- Sales figures need nothing but orders. Sessions, visitors, conversion and locations come from the store's built-in visitor tracking. Until it is connected, those tiles say Storefront tracking is not connected.
- A tile that needs something your store does not have says so, for example a point-of-sale channel, inventory tracking or fulfillment data.
- Days are cut in your store's time zone. After you change the time zone in Store details, stored daily figures are rebuilt in the background. Until that finishes, a notice says analytics is being recalculated and some daily totals may still shift.
- Stores that sell in several currencies see figures in one reporting currency, converted with the exchange rate of each day.
- The Home page shows a few of the same numbers at a glance.
If something goes wrong
- "Analytics is not available right now". The analytics service of the store did not answer. Try again in a minute.
- A tile says "No data for this date range". Nothing happened in the chosen range. Try a longer one.
- "Reports still use your previous time zone". The rebuild after a time zone change did not finish. Click Retry.
- Insights do not show. They need two weeks of sales data, and they are updated by the nightly analysis.