A dashboard is a page of tiles: key figures, charts, tables and notes for one area of your store. Poltura comes with six built-in dashboards. You can build your own from the same tiles.
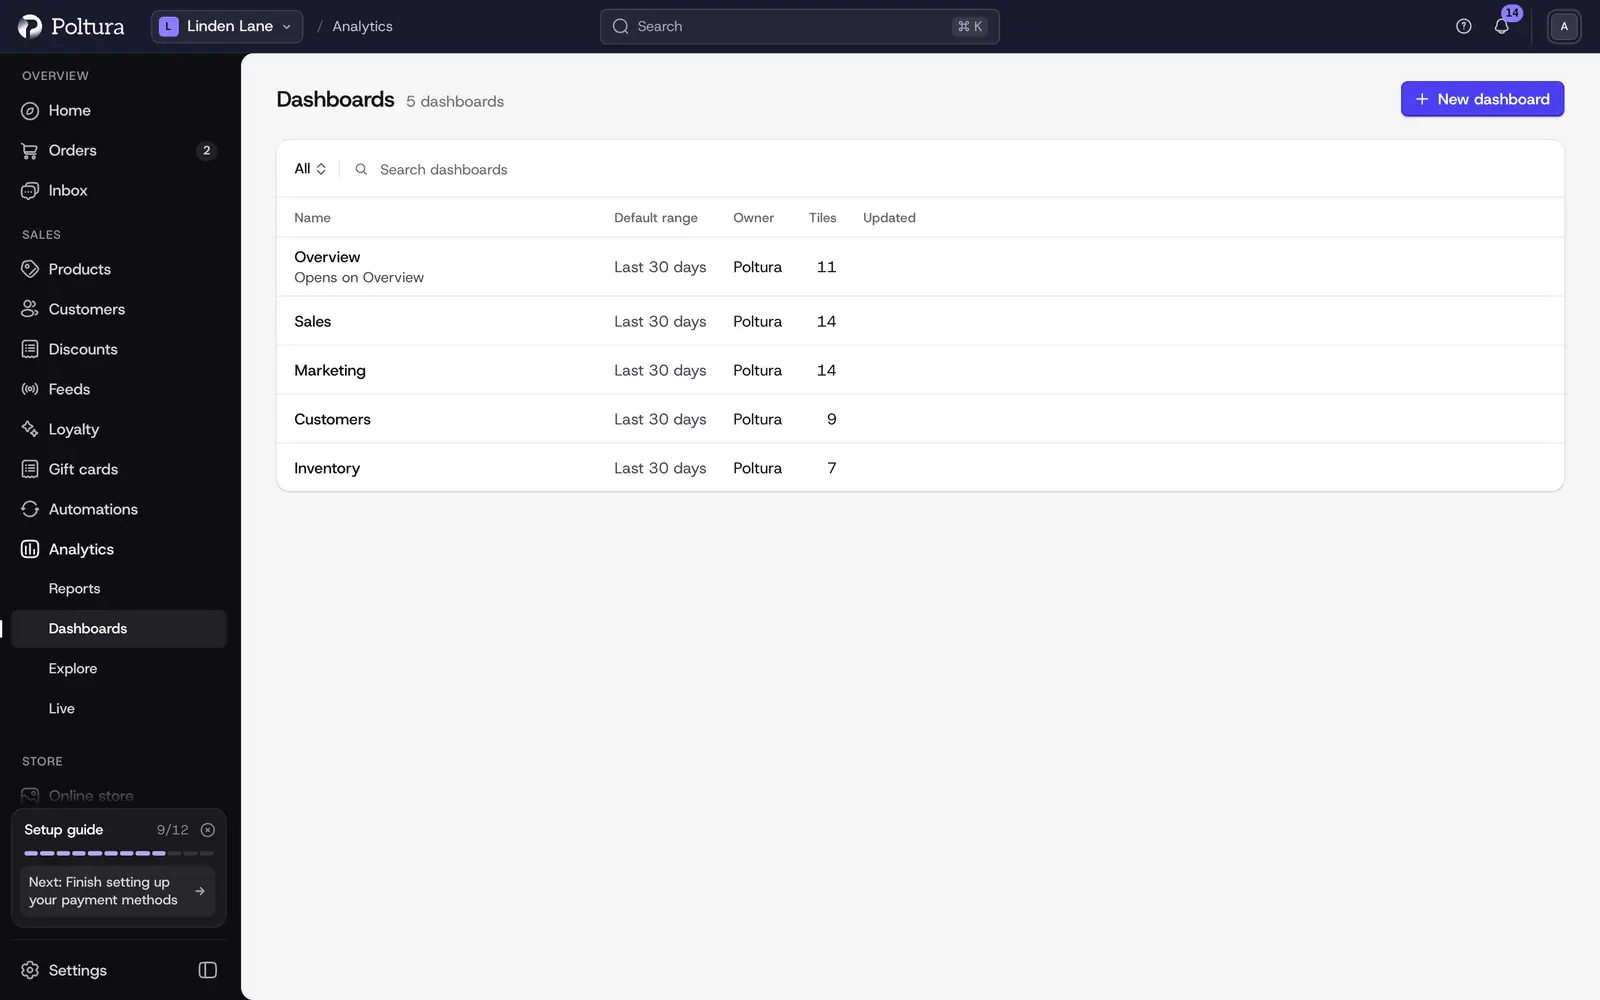
The built-in dashboards
- Overview: your store at a glance: sales, traffic, customers and stock.
- Sales: revenue, orders and what sells.
- Marketing: where visitors come from and which channels sell.
- Customers: new and returning customers, retention and value.
- Inventory: stock levels, sell-through and stock-outs.
- Retail: point-of-sale sales by location.
They are marked Built-in and cannot be changed. To change one, duplicate it first, on the Pro plan.
Open a dashboard
Under Analytics in the sidebar, choose Dashboards.
Click a dashboard's name. The list also shows its number of tiles, its default range, its owner (Poltura, Your team or Me) and when it was last updated.
Choose the date range and a comparison on top. Tiles marked Own range keep their own date range.
Create a dashboard
Building your own dashboards is part of the Pro plan, see Plans.
On the Dashboards page, click New dashboard. A dashboard named "Untitled dashboard" opens in edit mode.
Type a name in Dashboard name.
Click Add tile. The tile library opens.
Pick tiles from the library. Browse by category, type in Search tiles, or choose Saved reports for your own reports and Note for a text tile. Preview shows a tile with your own data.
Choose a Chart type if you want another picture of the same numbers, then the Size, and click Add. Only charts that fit the tile's data are listed.
Click Save. The message "Dashboard saved" confirms it.
To start from a built-in dashboard instead, open it and click Duplicate to customize.
Arrange tiles and sections
Open your dashboard and click Edit.
- Move a tile: drag it by its handle. With the keyboard, pick the tile up, move it with the arrow keys, drop it with
Spaceand cancel withEscape. - Change a tile's chart: open Chart type on the tile and pick another one, such as Dot matrix, Waterfall, Movers or Bubble map. The list only shows charts that fit the tile's data, with the suggested one marked.
- Resize a tile: drag the handle on its right edge. The dashboard has 12 columns and the tile snaps to them as you drag. In a full row, the tile beside it gets narrower or wider to keep the row level. You can also pick a column count under Size on the tile, or focus the handle and use the left and right arrow keys. Each chart has a smallest width it can use. Press
Escapeto cancel a drag. - Change a tile's tabs: tiles like Metric tabs hold several charts behind a switch. Open Tabs on the tile to add or remove them, from two to six.
- Rename, duplicate or remove a tile: use the tile's menu. After Remove, Undo brings the tile back.
- Give a tile its own date range: in the tile's menu choose Date range. Dashboard range makes it follow the dashboard again.
- Add a section: click Add section, type a title, and move tiles into it. Sections can be moved up and down, and removed.
- Set the default range: choose Default range for the range the dashboard opens with.
Undo and Redo step through your changes. Nothing is stored until you click Save. Discard takes the dashboard back to how it was when you last saved it.
Rename, duplicate, delete or set as Overview
Open the menu of the dashboard, on the list or on the dashboard itself.
Choose Rename, Duplicate, Set as Overview or Delete.
For Delete, confirm with Delete dashboard.
Set as Overview makes the dashboard the one that opens on the Overview for you. The dashboard then shows Shown on Overview.
Good to know
- A store can have up to 25 dashboards, and a dashboard up to 40 tiles.
- You can add a tile from other places too: Add to dashboard on a report and in Explore.
- An Insights tile shows the notable changes found by the nightly analysis, see Analytics.
- A tile that needs something your store does not have says what it needs, for example storefront tracking, a point-of-sale channel or inventory tracking.
- Reset to default in edit mode replaces your tiles and sections with the built-in layout. It is only stored when you click Save.
Plans
The built-in dashboards are on every plan. Creating, duplicating, editing and renaming dashboards are part of the Pro plan, together with Explore. On other plans these buttons show which plan unlocks them.
If you move from Pro to another plan, the dashboards you made stay. They keep showing your numbers, and you can still open them, set one as your Overview and delete them, but you cannot edit, rename or duplicate them until you are on Pro again.
If something goes wrong
- "Someone else saved this dashboard while you were editing." Click Reload their version and make your change again.
- "Couldn't save the dashboard. Your changes are still here." Click Save again in a moment.
- "Overview shows this dashboard. Set another one as Overview before deleting it." Choose Set as Overview on another dashboard first.
- "Custom dashboards are not available right now". The built-in dashboards still work. Try again in a minute to see yours.
- "Dashboard not found". It may have been deleted, or it belongs to someone else.
- "This dashboard already has 40 tiles." Remove a tile or use another dashboard.