Explore is for the questions the ready reports do not answer. You write a short query, or build one with controls. You see the answer as a chart or a table. A good answer can be saved as a report or put on a dashboard. Explore is part of the Pro plan, see Plans.
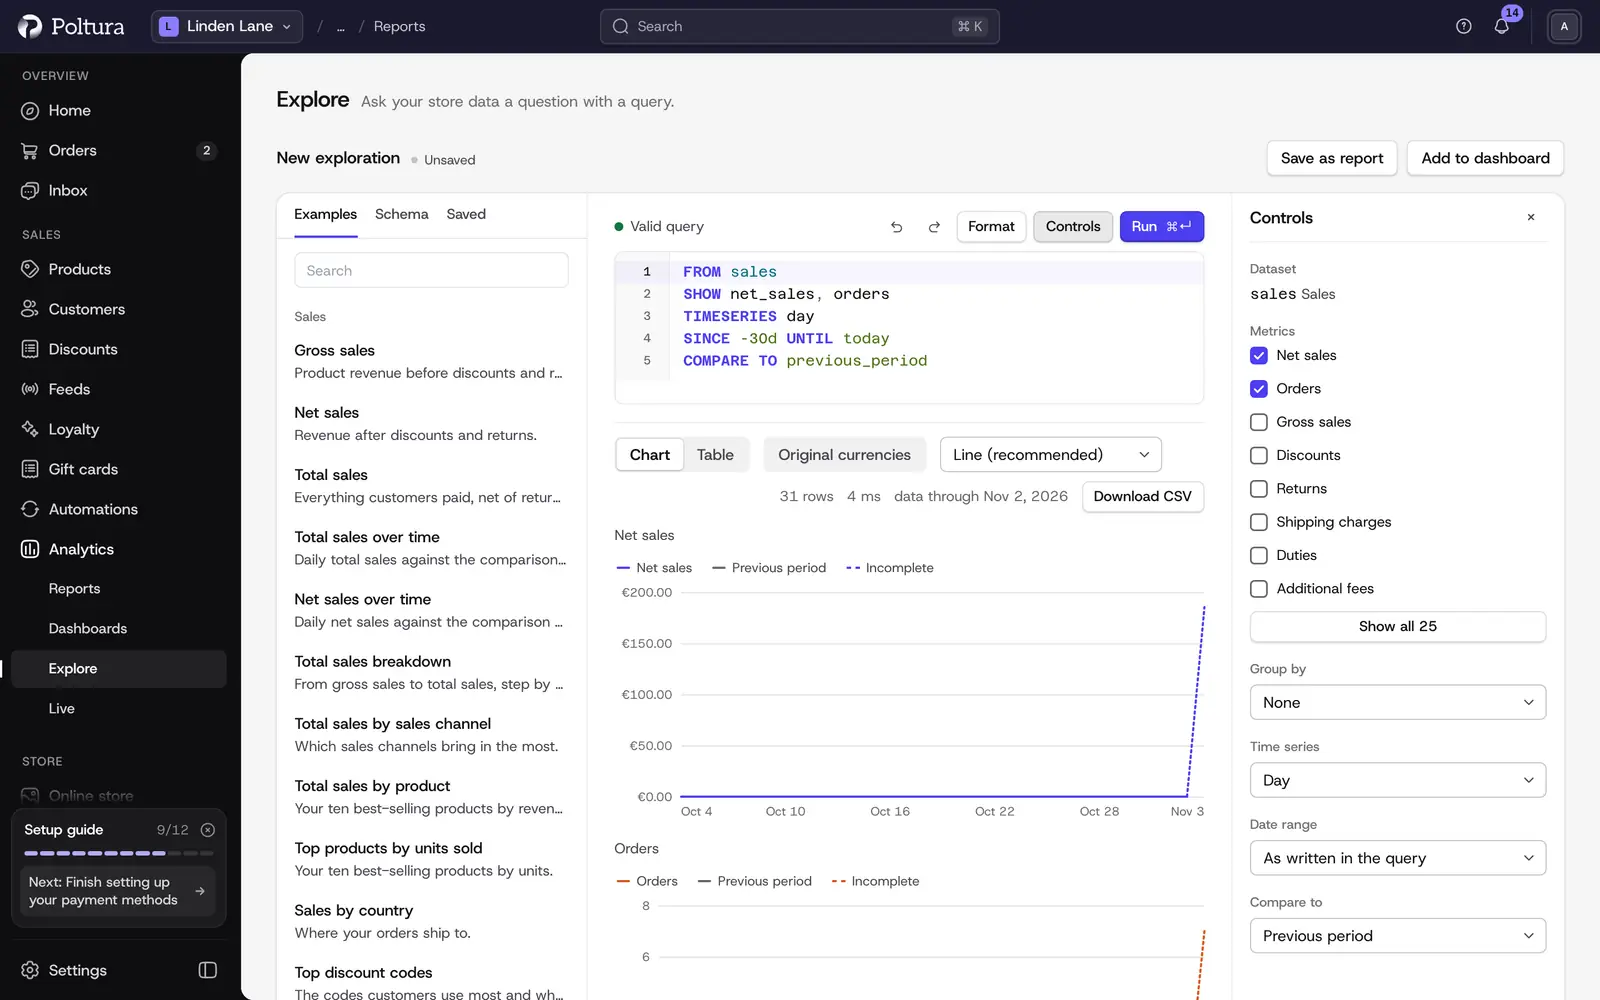
What a query looks like
A query names a dataset, the figures to show and the period. You can copy these and change them:
FROM sales SHOW total_sales DURING last_monthFROM sales SHOW total_sales TIMESERIES day SINCE -30d UNTIL todayFROM sales SHOW net_sales GROUP BY product_title DURING last_month ORDER BY net_sales DESC LIMIT 10The first gives one number, the second a line over the last 30 days, the third your ten best products by net sales. The datasets cover sales, orders, fulfillments, customers, products, inventory and sessions.
Run your first query
Under Analytics in the sidebar, choose Explore.
Open Examples and schema and pick an example under Examples. It is loaded into the editor, and Undo brings your previous query back.
Click Run, or press
⌘andEnter.Read the result under Result. Switch between Chart and Table, and pick another Chart type if you like. The recommended type is marked.
Under the result you see the number of rows and up to which day the data runs.
Build a query without typing
Click Controls.
Choose a Dataset, tick the Metrics to show, and pick a Group by if you want a breakdown.
Choose a Time series to see the figures over time, a Date range, and under Compare to the Previous period or Previous year.
Click Run. The controls write the query for you, so you can read it in the editor and change it by hand.
The controls work once the query names a dataset with FROM.
Write and fix a query
- The editor suggests datasets, metrics, dimensions and keywords as you type, and marks each kind.
- Under Schema in Examples and schema you find every metric and dimension of a dataset. Click one to insert it.
- The status under the editor says Valid query or counts the errors. An error names its line and column, and where Poltura can guess what you meant, Replace with fixes it in one click.
- Format tidies the query. Undo and Redo step through your edits.
Save the answer
Click Save as report.
Type a Name, optionally a description, and choose a Category.
Click Save report. The message "Report saved" appears, and the report is now in the report library and under Saved in Explore.
When you change a saved report, the status shows Unsaved changes and Save updates it.
Add the answer to a dashboard
Click Add to dashboard.
Choose the Dashboard, or New dashboard and type its name.
Choose the Tile size: One third, Half, Two thirds or Full width.
Click Add tile. The query becomes a tile at the end of the dashboard, and View opens it.
Download the result
Click Download CSV to save the rows of the result as a file you can open in a spreadsheet.
Good to know
- Queries that read sessions need the store's visitor tracking. Sales datasets work without it.
- A query can combine sales and sessions, for example to show sales next to the conversion rate.
- A large result shows the first rows only, and the result says how many.
- Dates follow your store's time zone, see Store details.
- New exploration starts again with an empty query.
Plans
Explore, saving reports and building your own dashboards are part of the Pro plan. The built-in dashboards and reports are on every plan, with their date range, comparison and other controls. On other plans, Explore and the buttons that create or change a dashboard or report show which plan unlocks them. See Plan and billing.
If you move from Pro to another plan, nothing is deleted. The reports and dashboards you made keep showing your numbers. You can still open them, set a dashboard as your Overview and delete them, but you cannot change them or open them in Explore until you are on Pro again.
Klea can answer questions about your numbers on every plan. Saving an answer as a report or a dashboard needs Pro.
If something goes wrong
- "Your query could not be run". The query has errors. Follow the links to the line and column, or use Replace with. Copy error copies the message.
- "The query ran but returned no rows." Try a longer date range or fewer filters.
- "Behaviour data isn't connected". The query reads sessions, which need visitor tracking. Use a sales dataset, or see Analytics.
- "Couldn't run this query". The analytics service did not answer. Try again in a moment. Your query stays in the editor.
- "Fix the errors in the query first." A query with errors cannot be saved as a report.
- "That report no longer exists, so this is a fresh exploration." The report you opened was deleted.